


Authors: T. Satiko, L.R. Alves
Solar active regions are magnetic regions in the solar corona related to sunspots. When observed in white (visible) light, sunspots are seen as dark regions because their temperatures are lower than the surrounding photosphere. Active regions are observed in ultraviolet wavelengths as bright regions (Figure 1) because they are filled with hot plasma (temperatures above 1 million K). During a solar flare, this brightness is even more intense.
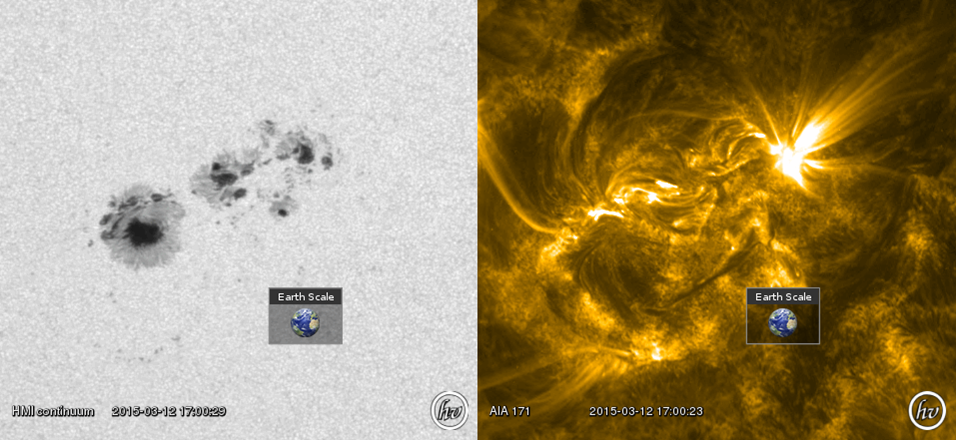
Figure 1: Sunspots are colder and darker than its surroundings, but the active region is hot and bright; in the pictures above the active region 2297 in seen in closeup with the Earth in scale. Source: Helioviewer.
The active region 2297 was in the solar disk during the first half of March, 2015. During this time, it produced more than 80 C-class flares (low intensity), more than 20 M-class flare (medium intensity) and a X2.1-class flare (strong intensity) on March 11th (Figure 2). A movie of this strong event can be seen here: http://helioviewer.org/?movieId=Wxrd5
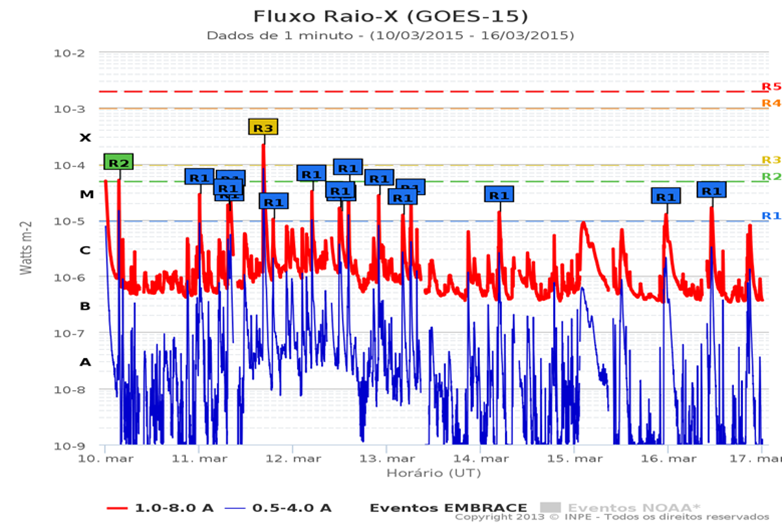
Figure 2: X-rays flux observed by XRS on board GOES and radio blackout detected by EMBRACE software during the passage of 2297 on the solar disk. Each peak in the red curve is a C, M or X event. The R events indicate that the ultraviolet emission disturbed the ionosphere. Source: EMBRACE.
In addition to the flares, on March 15th a coronal mass ejection was expelled directed to the Earth. Once it arrived on March 17th, the magnetic field orientation was favorable to geomagnetic storm and it triggered the most intense geomagnetic storm measured on cycle 24. The storm were associated to the aurora borealis observed at high and mid-latitude. The AE index was over 1500 nT for several periods during the day, which indicates strong magnetic substorm.
EMBRACE magnetometers (Figure 3) placed in the low latitude Brazilian sector, registered the CME arrival, associated to the 40 nT sudden impulse in the H component and the following geomagnetic storm G3 level (Kp=8). During the storm peak, the magnetometers registered a -320 nT drop in the H component. The main phase of this storm lasted several hours and the recovery phase extended for as long as a week.
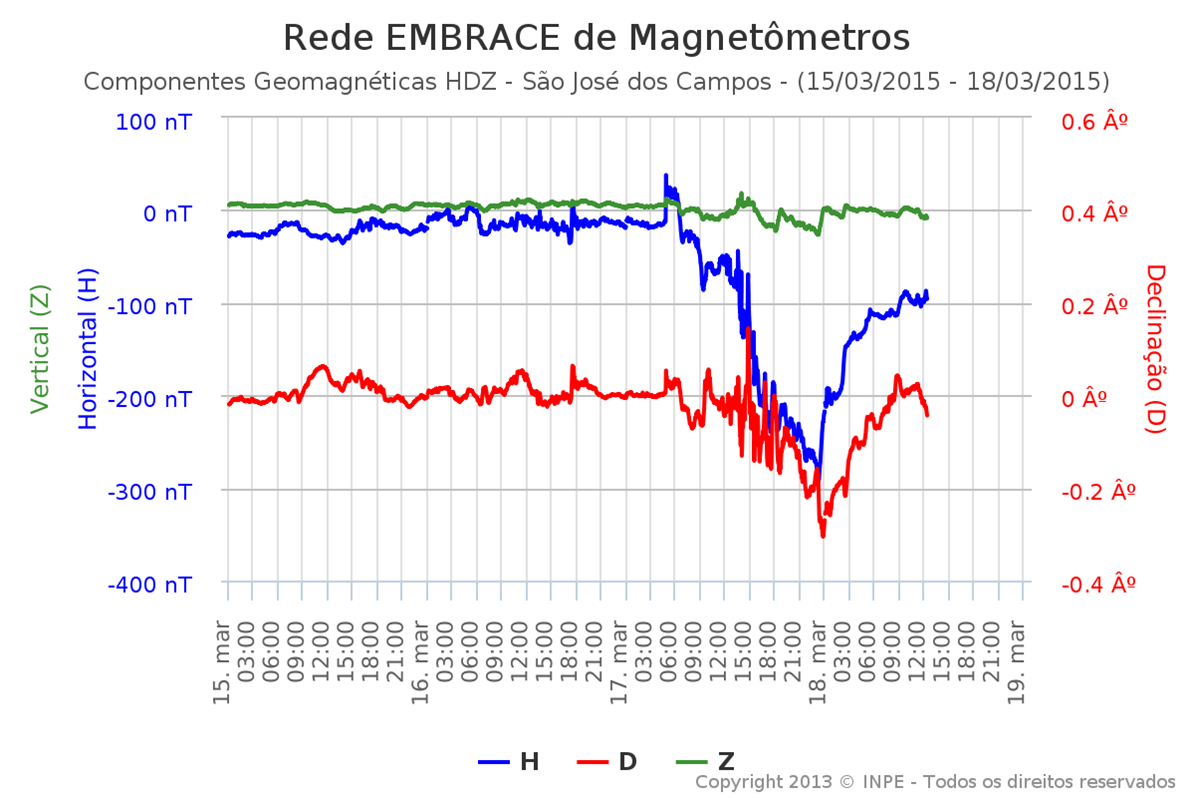
Figure 3: Earth’s magnetic field variation for all vector components registered in Brazil’s section in the SJC station during two calm days (March 15 and 16) followed by the CME impact and storm (March 17 and 18).
Magnetometers of the EMBRACE network were used to compute the K index over South America (Ksa), which reach 7+ during this event, as shown in Figure 4. Magnetic storms of level G3 can affect satellites orbits and interfere with radio communication frequencies.
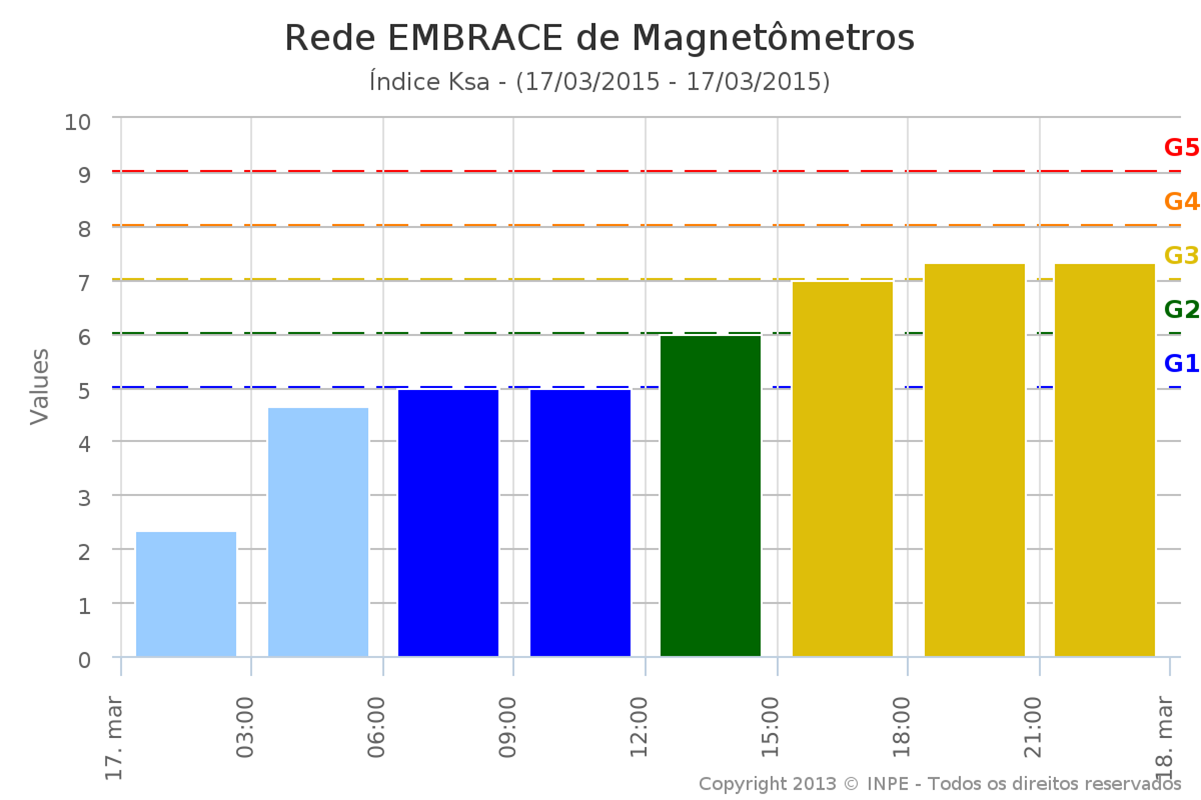
Figure 4: South America magnetic storm index evolution on March 17th.
During the passage of the active region 2297, several events of space weather in different topics were observed: from March 10th to 17th, geostationary satellite orbits were subjected to relativistic electrons and protons precipitating in the auroral region and to ionospheric variations due to the several flares, observed previous to the storm. Following these precursors, the storm itself started on March 17th, with the CME arrive, new ionospheric events were observed and ground induced electric currents were expected since the associated fast variations in the geomagnetic field were observed from magnetometer’s data.